Post by ewnation_NGX_Stock (@ewn)
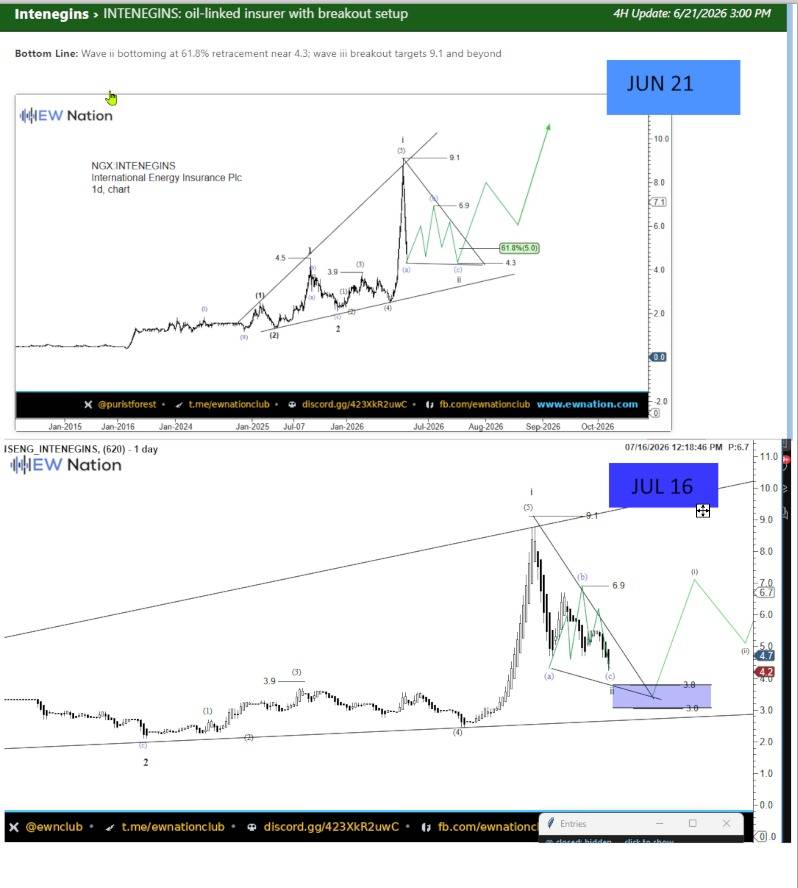
Here's a breakdown of what changed between the Jun 21 setup and the Jul 16 update on INTENEGINS:
What played out as expected
Wave (5)/wave i top and the (a)-(b)-(c) corrective structure for wave ii both confirmed — the chart is unfolding within the same Elliott framework you called on Jun 21.
Wave (b) landed almost exactly where flagged: 6.9 on Jun 21 vs 6.9 actual on the Jul 16 chart.
What's different / needs updating
Wave ii low revised deeper. Jun 21 had the 61.8% retracement target at 4.3. The Jul 16 chart shows (c) has pushed well below that, into a highlighted 3.0–3.8 zone — meaning price is tracking a deeper retracement than the original 61.8% Fib, likely closer to the 78.6–88.6% band.
New sub-wave labels appearing in the projection. The green forward path on Jul 16 now shows (i) and (ii) micro-labels on the projected advance (rallying to ~6.7 before a pullback), refining the earlier simple "wave iii breakout" arrow from Jun 21 into an actual impulsive sub-structure.
Live price context added. The Jul 16 chart carries a timestamp (07/16/2026 12:18:46 PM) with price markers at 6.7 / 4.7 / 4.2 on the right axis — giving readers a real-time anchor the Jun 21 version didn't have.
Targets unchanged at the top end — 9.1 and 6.9 levels are carried over identically, so the invalidation/target structure for wave iii itself hasn't changed, only the depth and timing of wave ii.
0 likes · 0 comments · 0 shares