Post by ewnation_NGX_Stock (@ewn)
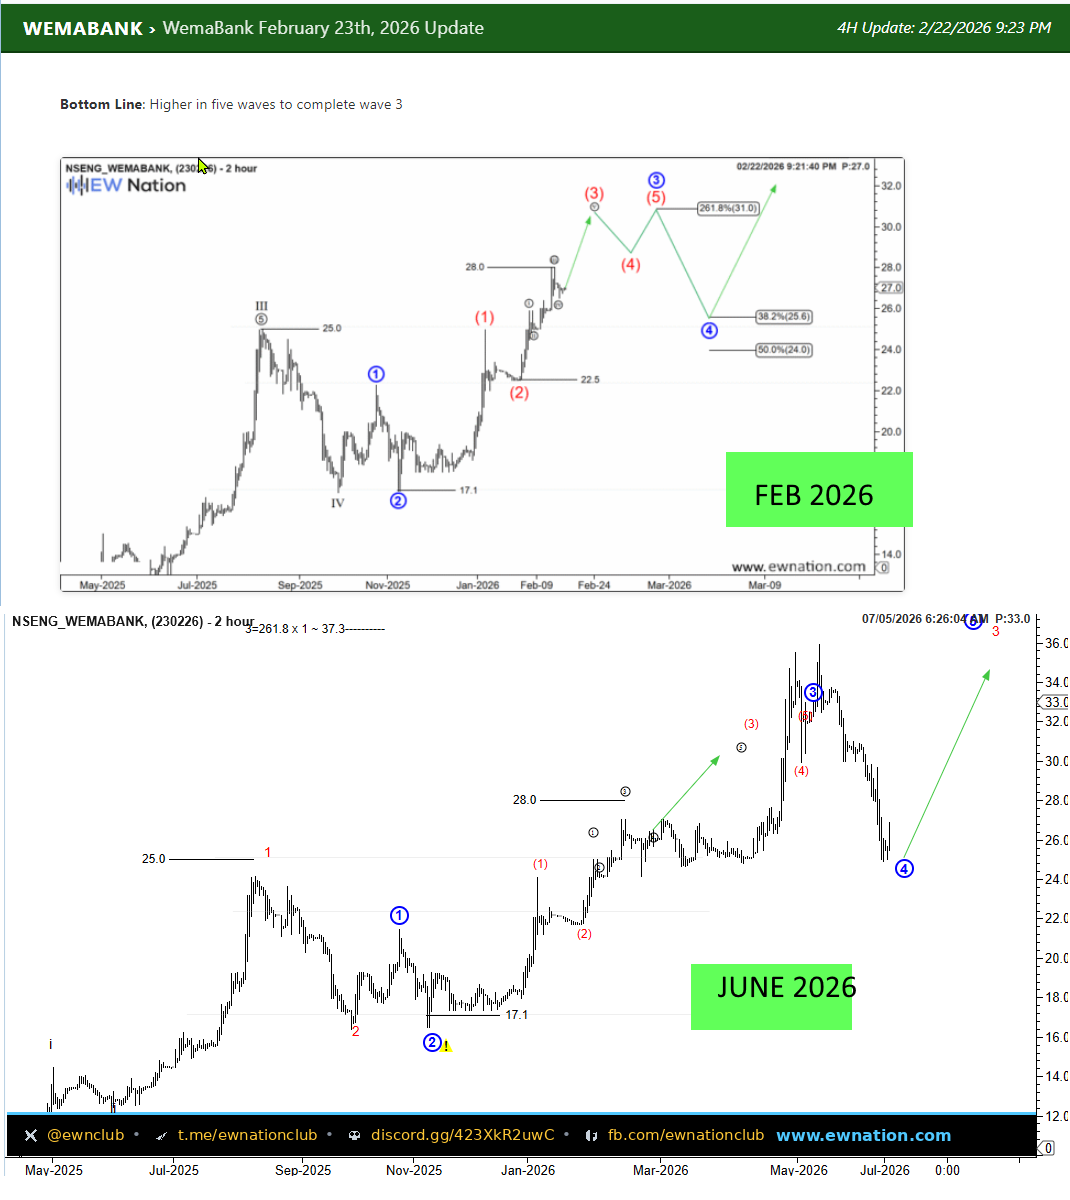
WemaBank :Here's how the February 2026 forecast stacks up against what actually happened by July 2026:
Forecast vs. Reality — WemaBank (NGX:WEMABANK)
What was called (Feb 23, 2026):
Wave (1)–(5) of blue wave ③ completing, with wave ③ itself still unfolding higher
Projected sub-wave sequence ①②③(4)④ topping out near 31.0 (261.8% extension)
A wave ④ pullback expected into the 24.0–25.6 zone (38.2%–50% retracement)
What actually played out (as of July 5, 2026):
https://ewnation.com/markets/wemabank-february-23th-2026-update/
Price pushed through the 28.0 area as called, then wave ③ extended further than projected, tagging roughly 33–36 before topping — overshooting the original 31.0 target, a common trait of a strongly extending third wave
The wave ④ correction landed almost exactly where forecast, pulling back into the ~24.0 zone, right in the 38.2–50% retracement band
Chart now shows price basing at wave ④ with a green projection arrow pointing toward a new high, implying wave ⑤ (or a continuation to complete wave 3 of a higher degree) is next
0 likes · 0 comments · 0 shares